Why?
Being a fan to many different genres of music, I was curious what would be my listening patterns during the period of one month.
Dataset
Most of the music I listen to is via the Spotify streaming service, so it was a perfect place to start checking things out. Retrieving a dataset with what had been streamed for a period of time was easy to do. I focused on the period of one month, and this was October 2021.
The idea was to check out for each day of the month how many tracks had been played and in which genre would they fit. Would there be a predominant genre throughout the month?
How?
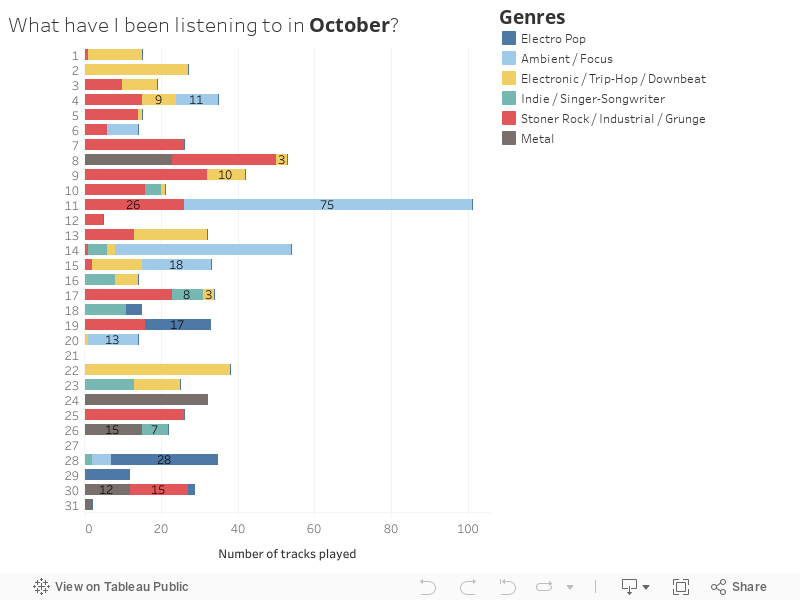
At first I started categorising the different tracks that I listened to each day by specific genres and sub-genres. In some cases I singled out some artists that were listened to more often, and I also included podcasts. A stacked pie chart was a simple way to easily visualise different colored categories in 31 columns.
But eventually there were just too many different categories (and colors) in the stacked pie chart, so the purpose was getting lost. I reduced this by aggregating several categories of genres into broader ones. I also removed the podcasts out of the chart.
